Beneficiation Plant
The Beneficiation Plant Dashboard is a comprehensive monitoring and management interface within the Iron Ore Procurement System Software, designed to provide real-time insights into beneficiation plant operations. This dashboard offers detailed tracking of stock levels, production outputs, consumption patterns, and supplier performance across the entire beneficiation process.
1. Dashboard Overview
Note:
All values shown in the screenshots and examples are dummy data used to demonstrate functionality. They do not represent actual operational data.
The Beneficiation Plant Dashboard provides a centralized view of all critical operational metrics:
Key Metrics Display
- Total Sinter Feed Stock: Real-time stock levels in metric tonnes
- Pellet Feed Production: Current production output tracking
- Sinter Feed Consumption: Material consumption monitoring
- Supplier Performance: Individual supplier contribution and usage rates
- Date Range Selection: Flexible date picker for historical data analysis
- Comparative Analysis: 30-day average comparisons for trend analysis
2. Stock Management
The dashboard provides comprehensive stock level monitoring:
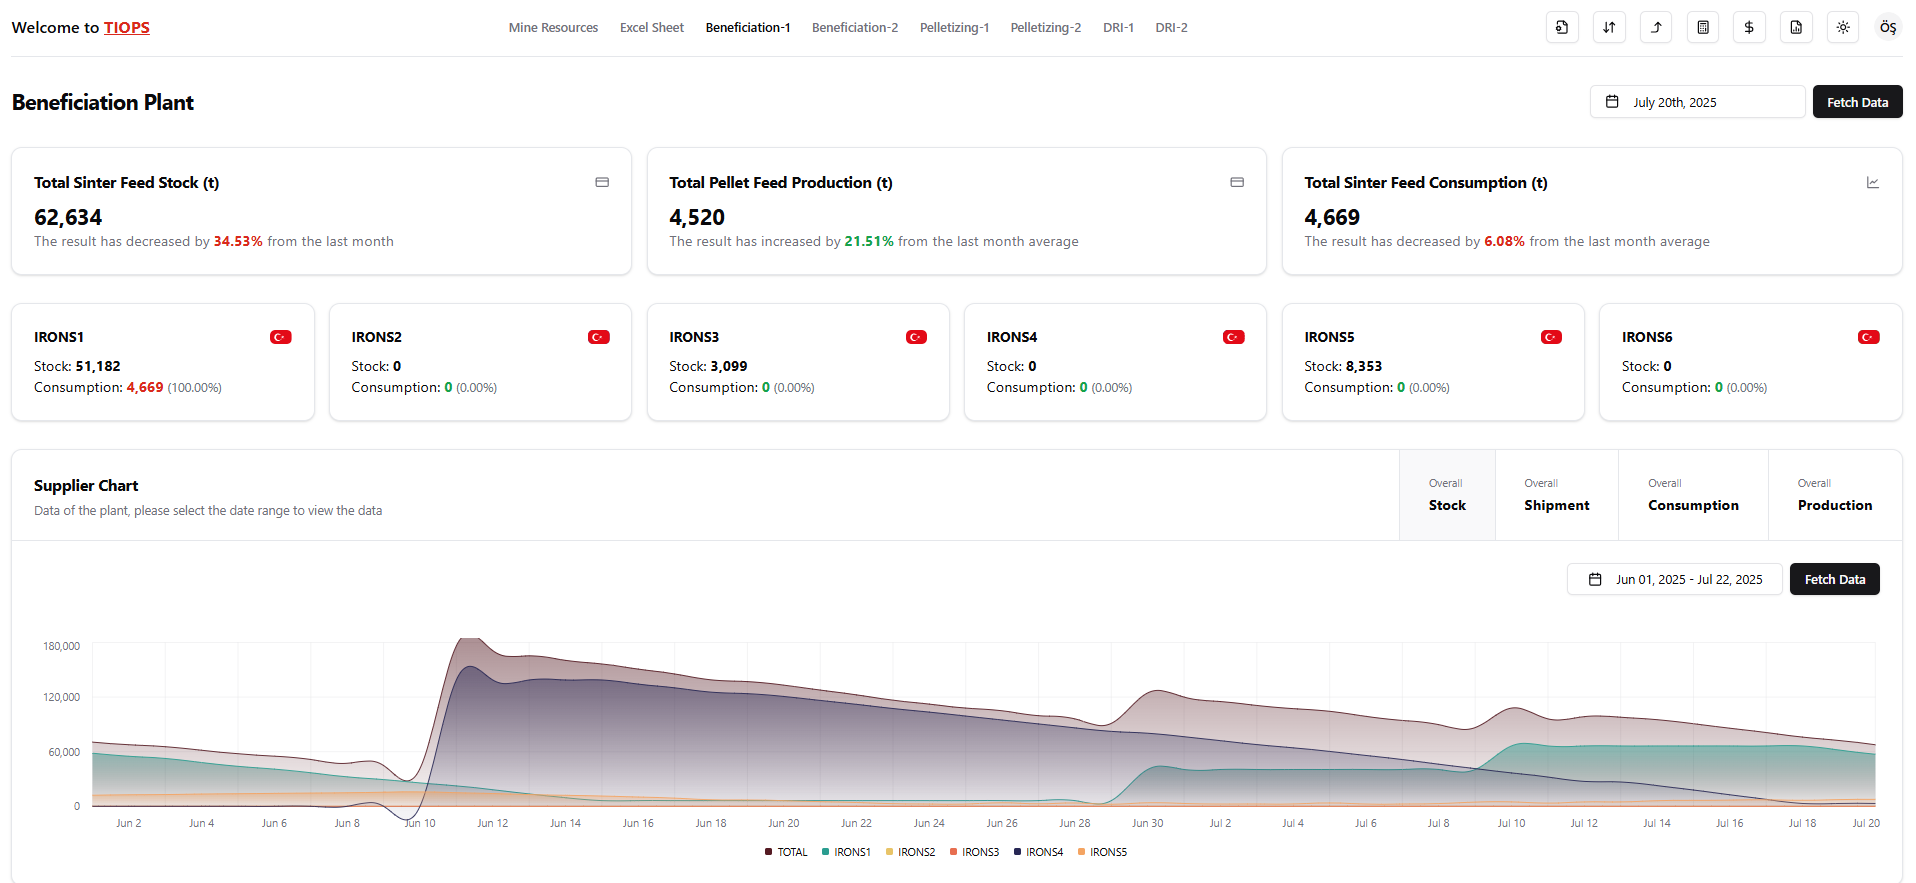
Total Sinter Feed Stock
- Current Stock Levels: Real-time display of total sinter feed inventory
- Historical Comparison: 30-day average stock level comparison
3. Production Monitoring
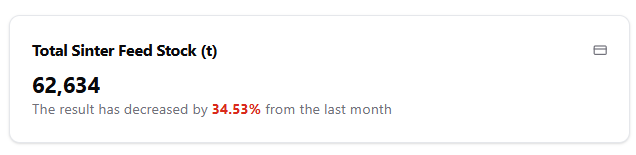
The system tracks pellet feed production with detailed analytics:
Production Metrics
- Daily Production: Track daily pellet feed production output
- Production Trends: Compare current production against historical averages
4. Consumption Tracking
The dashboard monitors sinter feed consumption patterns:
Consumption Metrics
- Daily Consumption: Track daily sinter feed consumption rates
- Consumption Trends: Monitor consumption pattern changes
- Historical Comparison: Compare current consumption against 30-day averages
Supplier Cards

- Individual Supplier Tracking: Monitor each supplier's performance separately
- Country Indicators: Flag indicators showing supplier country of origin
- Stock Contributions: Track each supplier's stock contribution
- Consumption Rates: Monitor supplier-specific consumption patterns
Performance Metrics
- Usage Rate Calculation: Calculate and display usage rates for each supplier
- Color-coded Performance: Visual indicators based on usage rates:
- Green: Usage rate ≤ 30% (optimal)
- Orange: Usage rate 30-50% (moderate)
- Red: Usage rate > 50% (high usage)
- Percentage Display: Show usage percentages for each supplier
- Comparative Analysis: Compare supplier performance against total consumption
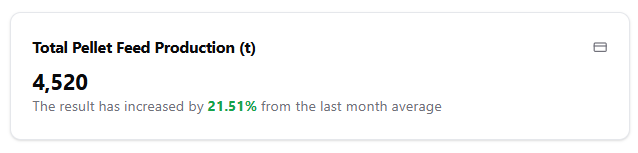
6. Interactive Charts
Note:
All values shown in the screenshots and examples are dummy data used to demonstrate functionality. They do not represent actual operational data.
The dashboard includes comprehensive charting capabilities:
Multi-Dataset Charts
- Stock Chart Data: Visual representation of stock level trends
- Consumption Chart Data: Display consumption pattern changes
- Shipment Chart Data: Track shipment arrival patterns
- Production Chart Data: Monitor production output trends
Chart Features
- Interactive Tooltips: Detailed information on hover
- Multiple Data Series: Display multiple datasets simultaneously
- Time Range Selection: Flexible date range selection for chart data
- Export Capabilities: Ability to export chart data for further analysis
7. Data Management
The dashboard includes comprehensive data management features:
Data Refresh
- Manual Refresh: Button to manually refresh all dashboard data
- Data Validation: Ensure data accuracy and consistency
- Error Handling: Graceful handling of data loading errors
8. User Interface Features
The dashboard provides an intuitive and responsive user interface:
Responsive Design
Note:
All values shown in the screenshots and examples are dummy data used to demonstrate functionality. They do not represent actual operational data.
- Mobile Optimization: Full functionality on mobile devices
- Desktop Enhancement: Enhanced interface for desktop users
- Adaptive Layout: Interface adapts to different screen sizes
- Touch-friendly Controls: Optimized for touch devices
This comprehensive Beneficiation Plant Dashboard provides the foundation for effective operational monitoring and decision-making in iron ore beneficiation processes, enabling users to track performance, identify trends, and optimize operations for maximum efficiency.