DRI Plant
The DRI Plant Dashboard is a comprehensive monitoring and management interface within the Iron Ore Procurement System Software, designed to provide real-time insights into Direct Reduced Iron (DRI) plant operations. This dashboard offers detailed tracking of pellet stock levels, DRI production outputs, pellet consumption patterns, and supplier performance across the entire DRI production process.
1. Dashboard Overview

Note:
All values shown in the screenshots and examples are dummy data used to demonstrate functionality. They do not represent actual operational data.
The DRI Plant Dashboard provides a centralized view of all critical operational metrics:
Key Metrics Display
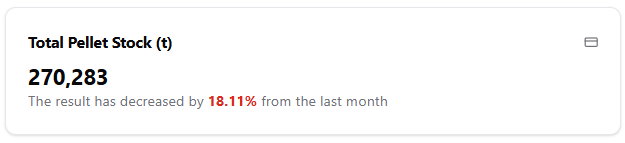
- Total Pellet Stock: Real-time pellet stock levels in metric tonnes
- Total DRI Production: Current DRI production output tracking
- Pellet Consumption: Pellet consumption monitoring for DRI production
- Supplier Performance: Individual supplier contribution and usage rates
- Date Range Selection: Flexible date picker for historical data analysis
- Comparative Analysis: 30-day average comparisons for trend analysis
2. Stock Management
The dashboard provides comprehensive stock level monitoring:
Total Pellet Stock
- Current Stock Levels: Real-time display of total pellet inventory for DRI production
- Historical Comparison: 30-day average stock level comparison
3. Production Monitoring
The system tracks DRI production with detailed analytics:
Production Metrics
- Daily Production: Track daily DRI production output
- Production Trends: Compare current production against historical averages

4. Consumption Tracking
The dashboard monitors pellet consumption patterns for DRI production:
Consumption Metrics
- Daily Consumption: Track daily pellet consumption rates for DRI production
- Consumption Trends: Monitor consumption pattern changes
- Historical Comparison: Compare current consumption against 30-day averages
Supplier Cards

- Individual Supplier Tracking: Monitor each supplier's performance separately
- Country Indicators: Flag indicators showing supplier country of origin
- Stock Contributions: Track each supplier's pellet stock contribution
- Consumption Rates: Monitor supplier-specific pellet consumption patterns
- Shipment Tracking: Monitor pellet shipment arrivals from each supplier
Performance Metrics
- Usage Rate Calculation: Calculate and display usage rates for each supplier
- Color-coded Performance: Visual indicators based on usage rates:
- Green: Usage rate ≤ 30% (optimal)
- Orange: Usage rate 30-50% (moderate)
- Red: Usage rate > 50% (high usage)
- Percentage Display: Show usage percentages for each supplier
- Comparative Analysis: Compare supplier performance against total consumption
- Shipment Data: Track pellet shipment quantities from each supplier
6. Interactive Charts
Note:
All values shown in the screenshots and examples are dummy data used to demonstrate functionality. They do not represent actual operational data.
The dashboard includes comprehensive charting capabilities:
Multi-Dataset Charts
- Stock Chart Data: Visual representation of pellet stock level trends
- Consumption Chart Data: Display pellet consumption pattern changes
- Shipment Chart Data: Track pellet shipment arrival patterns
- Production Chart Data: Monitor DRI production output trends
Chart Features
- Interactive Tooltips: Detailed information on hover
- Multiple Data Series: Display multiple datasets simultaneously
- Time Range Selection: Flexible date range selection for chart data
- Export Capabilities: Ability to export chart data for further analysis
8. User Interface Features
The dashboard provides an intuitive and responsive user interface:
Responsive Design
Note:
All values shown in the screenshots and examples are dummy data used to demonstrate functionality. They do not represent actual operational data.
- Mobile Optimization: Full functionality on mobile devices
- Desktop Enhancement: Enhanced interface for desktop users
- Adaptive Layout: Interface adapts to different screen sizes
- Touch-friendly Controls: Optimized for touch devices
This comprehensive DRI Plant Dashboard provides the foundation for effective operational monitoring and decision-making in Direct Reduced Iron production processes, enabling users to track performance, identify trends, and optimize operations for maximum efficiency.